NukeAnalytics
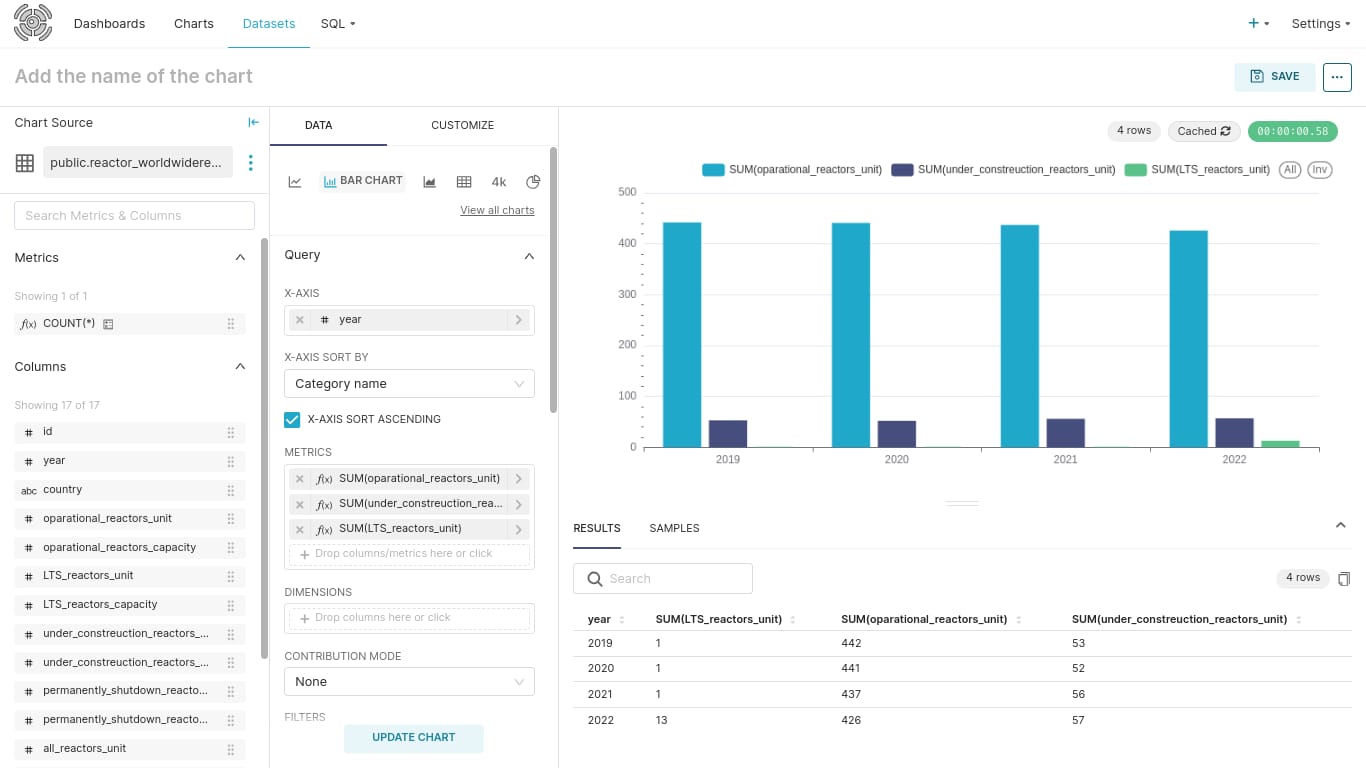
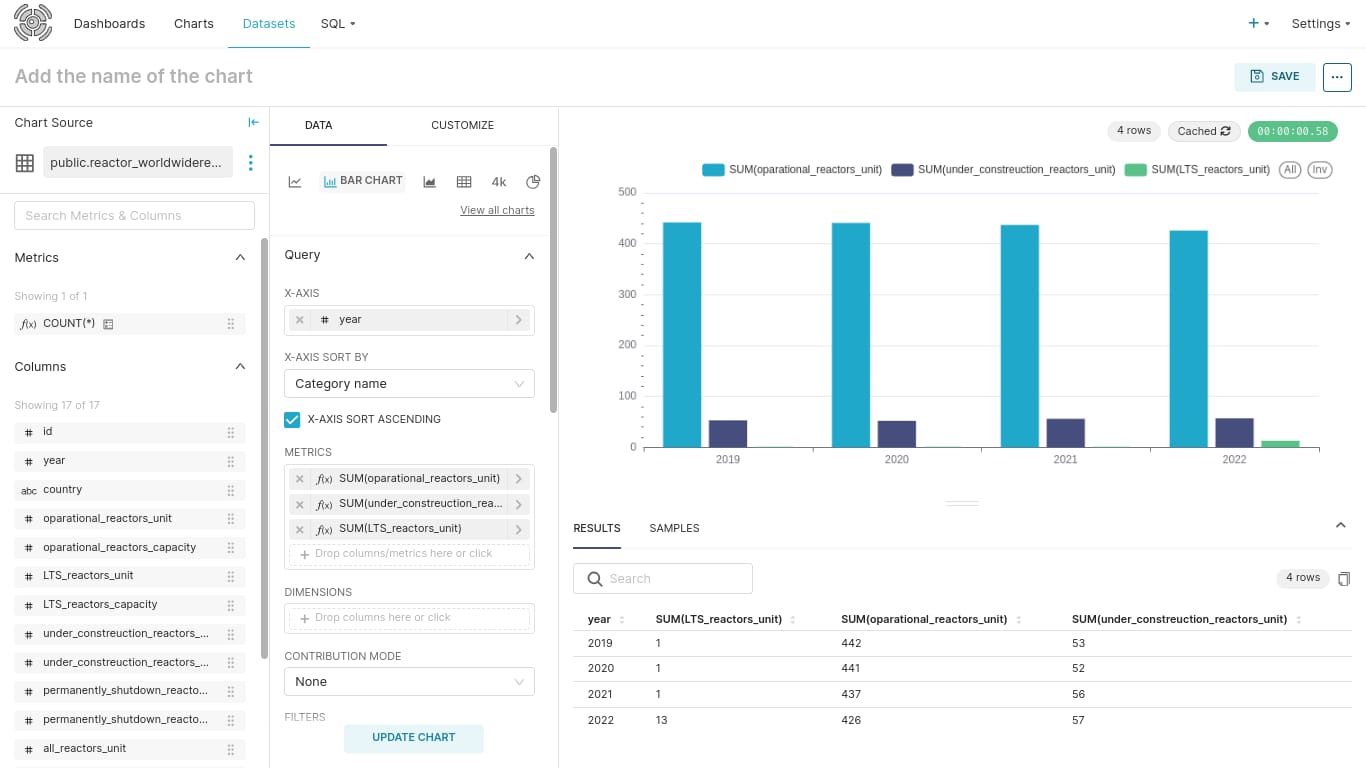
Make use of the PRIS database to analyze the data using SQL Lab and generate charts and dashboards.
Powered by Apache Superset
Explore nuclear data with SQL Lab, craft insightful charts, and build interactive dashboards.
Rich Visualizations
Diverse set of charts, graphs, tables, and maps powered by D3.js and Plotly.
Interactive Dashboards
Drag-and-drop canvas for building dynamic dashboards with multiple charts and filters.
SQL Lab
Write SQL queries directly within the interface for flexible data exploration and analysis.
Custom Datasets
Add custom tables and datasets alongside the built-in PRIS nuclear reactor database.
Data Sources
NukeAnalytics connects to authoritative nuclear data sources.
Power Reactor Information System
IAEA's comprehensive database of nuclear power reactors worldwide.
Reference Data Series No. 1
Energy, electricity, and nuclear power estimates through 2050.
Reference Data Series No. 2
Comprehensive data on nuclear power reactors globally.
Start Analyzing Nuclear Data
Connect to the PRIS database and uncover insights with interactive visualizations.